- 您现在的位置:买卖IC网 > Sheet目录321 > DM240011 (Microchip Technology)KIT STARTER MPLAB FOR PIC24F MCU
MPLAB Starter Kit for PIC24F User’s Guide
2.2.2
USB Flash Drive Interface (USB Embedded Host)
This demo shows the ability of the PIC24F microcontroller to function as an embedded
host by reading data from a USB Flash drive. To access the demo, select “Flash Drive”
from the main menu.
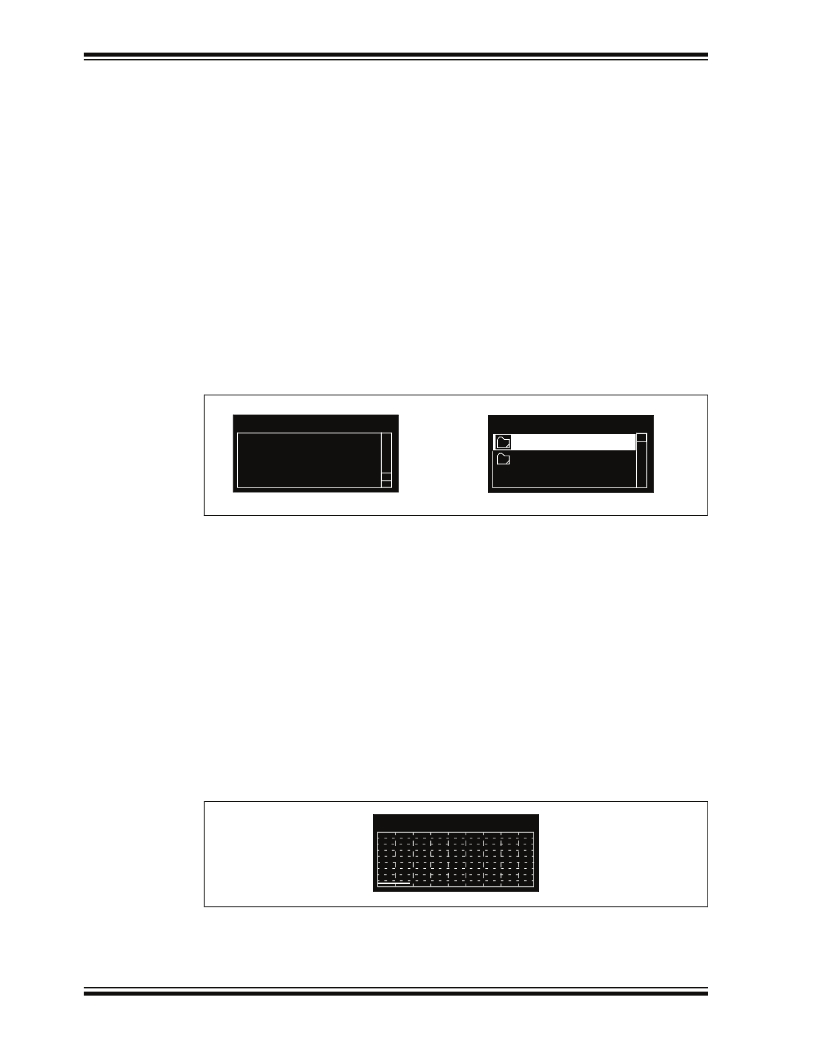
If a USB Flash drive with files is plugged in to the USB A-receptacle (J4), the display
shows the drive volume name and top level file structure in a list box (Figure 2-5). Long
file and directory names are truncated according to earlier Microsoft 8+3 file system
conventions (e.g., Longfilename.doc would be truncated as LONGFI~1.doc ). Use
the up/down arrow keys to scroll through the directory.
Subdirectories are indicated by names with a folder symbol next to them, and are
opened by pressing the center touch pad. To move up a directory level, select the “..”
entry at the top of the menu window and press the center touch pad.
If a Flash drive is not present, the display shows an empty menu window and the mes-
sage “Insert media”. If the Flash drive has no content, the display will show only the
drive volume name.
To exit the Flash Drive demo and return to the main menu, press the left arrow touch pad.
FIGURE 2-5:
TYPICAL DISPLAYS FOR THE FLASH DRIVE INTERFACE
i Insert media...
i \THUMB
.\SUBDIR~1
.\TRANSFER
CAPTURE.CSV
2.2.3
Real-Time Data Graphing (A/D and Display Multitasking)
As an additional demonstration of the application’s ability to interact with users in real
time, the Data Graphing demo shows the capture and conversion of analog data to
graphic information as it happens. In this demo, the input from the potentiometer (R44)
is converted by the microcontroller ’s A/D converter to digital information, and plotted as
a time vs. amplitude graph on the OLED display.
To access this demo, select “Demos” from the main menu, then “Graph” from the
“Demonstrations” menu. A horizontally scrolling graph appears with a solid line indicat-
ing the current position of the potentiometer. Turning the potentiometer through its
entire range changes the y-coordinate of the line in real time. At its default setting, the
application updates the value from the potentiometer every 100 ms; each time axis
division represents approximately 2 seconds. To increase or decrease the graph’s
update rate, press the right or left arrow touch pads, respectively.
To exit the demo and return to the main menu, press the center touch pad.
DS51725A-page 12
FIGURE 2-6:
DATA GRAPHING DISPLAY
i Potentiometer Graph
? 2008 Microchip Technology Inc.
发布紧急采购,3分钟左右您将得到回复。
相关PDF资料
DM240021
KIT STARTER MPLAB FOR PIC24H
DM240311
BOARD DEV PIC24F16KA102 XLP
DM300018
BOARD DEMO DSPICDEM 2
DM300019
BOARD DEMO DSPICDEM 80L STARTER
DM300024
KIT DEMO DSPICDEM 1.1
DM330012
KIT USB STARTER FOR DSPIC33E
DM330013
MICROSTICK DSPIC33F/PIC24H BOARD
DNET1
SURGE SUPPRESSOR ETHERNET RJ45
相关代理商/技术参数
DM240012
功能描述:开发板和工具包 - PIC / DSPIC PIC24E USB Starter Kit RoHS:否 制造商:Microchip Technology 产品:Starter Kits 工具用于评估:chipKIT 核心:Uno32 接口类型: 工作电源电压:
DM240013-1
功能描述:开发板和工具包 - PIC / DSPIC Microstick for 3V PIC24F K-series
RoHS:否 制造商:Microchip Technology 产品:Starter Kits 工具用于评估:chipKIT 核心:Uno32 接口类型: 工作电源电压:
DM240013-2
功能描述:开发板和工具包 - PIC / DSPIC
RoHS:否 制造商:Microchip Technology 产品:Starter Kits 工具用于评估:chipKIT 核心:Uno32 接口类型: 工作电源电压:
DM240014
制造商:Microchip Technology Inc 功能描述:MICROSTICK FOR USB PIC24F - Boxed Product (Development Kits) 制造商:Microchip Technology Inc 功能描述:ACCY MICROSTICK USB PIC24F 制造商:Microchip Technology Inc 功能描述:MICROSTICK USB PIC24F
DM240015
制造商:Microchip Technology Inc 功能描述:MPLAB STARTER KIT FOR PIC24F INTELLIGENT INTEGRATED ANALOG - Boxed Product (Development Kits) 制造商:Microchip Technology Inc 功能描述:KIT MPLAB STARTER FOR PIC24F ANL 制造商:Microchip Technology Inc 功能描述:PIC24F GC INTELLIGENT ANALOG DEV KIT 制造商:Microchip Technology Inc 功能描述:PIC24F, GC INTELLIGENT ANALOG, DEV KIT 制造商:Microchip Technology Inc 功能描述:Starter Kit for PIC24F Intelligent Integrated Analog Series 制造商:Microchip Technology Inc 功能描述:Development Boards & Kits - PIC / DSPIC 制造商:Microchip Technology Inc 功能描述:PIC24F, GC INTELLIGENT ANALOG, DEV KIT, Silicon Manufacturer:Microchip, Core Arc 制造商:Microchip Technology Inc 功能描述:PIC24F, GC INTELLIGENT ANALOG, DEV KIT, Silicon Manufacturer:Microchip, Core Architecture:PIC, Core Sub-Architecture:PIC24, Silicon Core Number:PIC24FJ128GC010, Silicon Family Name:PIC24FJxxxGCxxx, Kit Contents:Starter Board 制造商:Microchip Technology Inc 功能描述:MPLAB Starter Kit for PIC24F Intelligent Integrated Analog, Starter Kits
DM240021
功能描述:开发板和工具包 - PIC / DSPIC MPLAB STARTER KIT FOR PIC24H RoHS:否 制造商:Microchip Technology 产品:Starter Kits 工具用于评估:chipKIT 核心:Uno32 接口类型: 工作电源电压:
DM240311
功能描述:开发板和工具包 - PIC / DSPIC XLP 16-bit Dev Board RoHS:否 制造商:Microchip Technology 产品:Starter Kits 工具用于评估:chipKIT 核心:Uno32 接口类型: 工作电源电压:
DM240312
功能描述:开发板和工具包 - PIC / DSPIC PIC24FJ256DA210 Dev Board RoHS:否 制造商:Microchip Technology 产品:Starter Kits 工具用于评估:chipKIT 核心:Uno32 接口类型: 工作电源电压:
